 The Hidden Snowflake Bottleneck Behind Parallel Upserts
When a scalable-looking integration design quietly turns one table into the real problem.
Key takeaways
- Parallel event processing can look scalable, while the real constraint appears later when many writes converge on the same Snowflake target table.
- This issue is easy to mistake for a warehouse sizing problem, but concurrent DML contention is a different class of bottleneck.
- Snowflake query history can expose the pattern through blocked time, especially the transaction_blocked_time field.
- The fix is often architectural, batch, stage, serialize, or reshape the write path, not simply add more compute.
- This is a broader integration lesson, not a problem limited to one source system or one orchestration tool.
A pattern that looks right, until it doesn’t
Some integration issues announce themselves early. A broken credential fails fast. A missing field breaks a mapping. A bad endpoint usually gives you an error you can chase right away.
This one is different.
It starts inside a pattern most teams would describe as modern and scalable. Operational systems emit changes. A workflow layer reacts. An integration layer transforms the payload and pushes an upsert into Snowflake. Each piece is clean. Each event is small. Everything feels reasonable.
Then the friction starts to appear, not as an obvious outage, but as a system that feels slightly tighter each time activity rises. Some writes take longer. Some statements wait. Eventually, the problem stops looking random.
The architecture behind the surprise
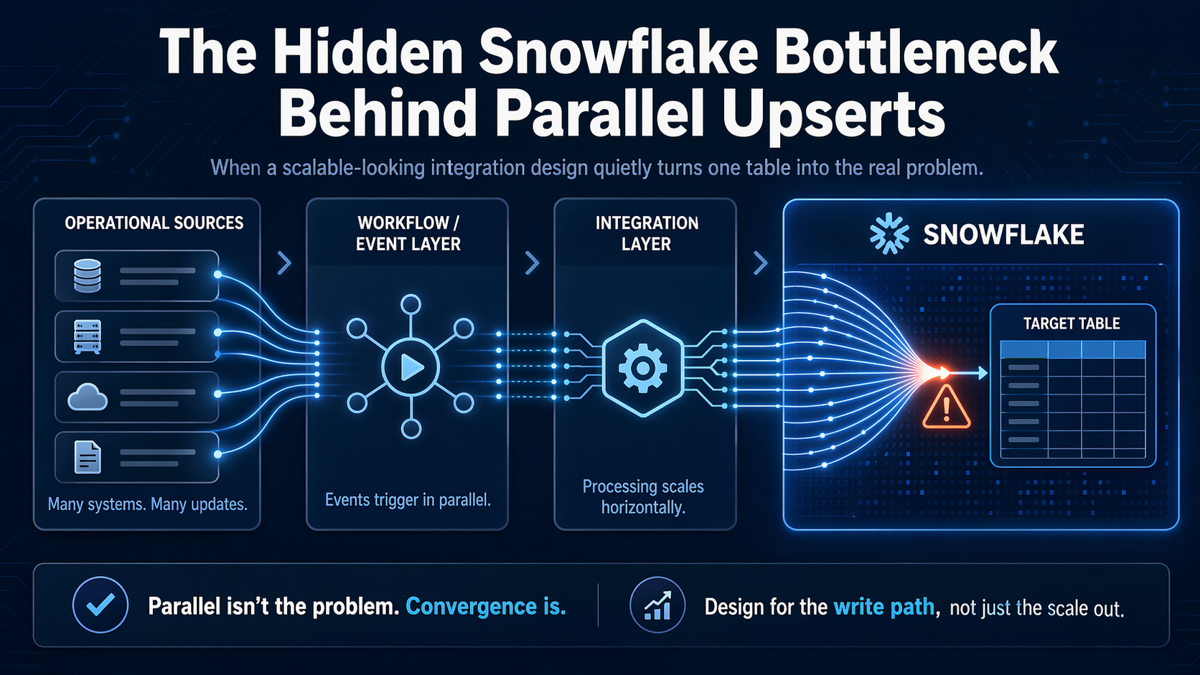
At a high level, the pattern looks like this:

Figure 1. A generic event-driven pipeline where parallel upserts converge on one Snowflake target table.
This is why the issue is so easy to miss. Each stage seems to scale in the right direction. Sources can emit events independently. The workflow layer can fan out. The integration layer can process multiple requests. But the write path narrows near the end, where many parallel upserts all try to affect the same target.
The wrong suspects usually show up first
When a pattern like this starts struggling, teams often investigate the usual suspects first:
- Is the warehouse too small?
- Is the SQL inefficient?
- Is the integration layer pushing too aggressively?
- Are upstream systems creating unexpected bursts?
Those are reasonable questions, but they can distract from the real answer. A design can be healthy at the orchestration layer and still become unstable at the destination because many write operations are converging on one table at the same time.
The reveal: the bottleneck is in the write path
This is where the real lesson emerges.
Snowflake can process large workloads well, but parallel writes against the same target are not the same as general platform scale. When enough DML statements pile up on one hot table, you can run into contention and lock waiting. In the most visible cases, Snowflake may surface an error along the lines of: "The number of waiters for this lock exceeds the 20 statements limit."
That detail changes the way the whole story reads. The issue is not that the integration was badly designed in a generic sense. The issue is that the design is optimized for moving events quickly, without fully accounting for how the destination absorbs simultaneous writes.
Why this matters more than it first appears
This is not a lesson about one source platform or one integration product. It applies to any architecture where:
- multiple source events arrive independently,
- parallel processing is encouraged, and
- all roads eventually lead to the same Snowflake table.
That includes API-driven integrations, workflow automations, CDC-style patterns, webhook pipelines, and custom services. The tools can vary. The architectural trap stays the same.
How to confirm the pattern in Snowflake
Snowflake gives you signals that help separate warehouse pressure from concurrent write contention. One useful place to look is query history, especially blocked-time-related fields such as transaction_blocked_time.
A simple diagnostic query can help identify statements that were blocked or failed around the same window:
SELECT
 start_time,
 query_id,
 user_name,
 warehouse_name,
 query_type,
 execution_status,
 total_elapsed_time,
 transaction_blocked_time,
 error_code,
 error_message,
 query_text
 FROM SNOWFLAKE.ACCOUNT_USAGE.QUERY_HISTORY
 WHERE start_time >= DATEADD('hour', -24, CURRENT_TIMESTAMP())
 AND (
 transaction_blocked_time > 0
 OR error_message ILIKE '%20 statements limit%'
 )
 ORDER BY start_time DESC;
If you see blocked time rising around bursts of upsert activity, you are no longer dealing with a vague performance concern. You are looking at a write-contention pattern.
What to do instead
The good news is that the answer is usually not mysterious once the pattern is understood. The bad news is that the answer is often architectural.
1. Stage first, merge second
Instead of turning every event into a direct upsert on the final table, land incoming changes in a staging area and merge them into the target in a more controlled way. This reduces simultaneous pressure on the hot table and gives you more control over write behavior.
2. Micro-batch the traffic
If true per-event immediacy is not required, group changes into short batches. Even a small delay can dramatically change the concurrency profile at the point of write.
3. Serialize hot-table writes
For some targets, the safest design is to funnel writes through a queue or a controlled worker so the destination is protected from bursts that look harmless upstream but collide downstream.
4. Re-evaluate the workload type
If the workload behaves more like an operational transaction system than an analytical write pattern, that is an architectural signal in itself. It may mean the pipeline needs to separate ingestion from serving, or that the table design and data flow assumptions need to be revisited.
Common pitfalls
- Assuming warehouse concurrency settings solve table-level write contention.
- Testing only with low parallelism, then discovering the real behavior in production.
- Treating every upstream event as an immediate write instruction for the final target table.
- Monitoring only failures instead of watching blocked time and growing contention first.
Why this is a strong lesson for integration teams
The most interesting part of this issue is not the number itself. It is the false confidence that comes before the number appears.
The pipeline can look modern, responsive, and horizontally scalable. That is what makes the eventual bottleneck surprising. The hidden constraint is not at the edge of the architecture, where events enter. It is near the center of the value path, where many separate flows try to become one write pattern.
Conclusion
A lot of integration designs focus on how to move data faster. Fewer spend equal energy on how the destination wants to receive it.
That is the deeper point behind this Snowflake bottleneck. Parallelism is not automatically the problem. The real issue appears when parallel activity converges on one table, and the write path becomes the narrowest part of the system.
If there is one takeaway worth keeping, it is this: design for the write path, not just the scale out.
References
- Snowflake Documentation, Query concurrency and MAX_CONCURRENCY_LEVEL: https://docs.snowflake.com/en/user-guide/performance-query-warehouse-max-concurrency
- Snowflake Documentation, QUERY_HISTORY and transaction_blocked_time: https://docs.snowflake.com/en/sql-reference/functions/query_history
- Snowflake Documentation, ACCOUNT_USAGE.QUERY_HISTORY: https://docs.snowflake.com/en/sql-reference/account-usage/query_history
- Snowflake Documentation, Hybrid tables overview: https://docs.snowflake.com/en/user-guide/tables-hybrid
- Snowflake Community, lock waiters and the 20 statements limit: https://community.snowflake.com/s/article/Query-Failed-with-Lock-Exceeds-Error


Carlos Alves
I’m Carlos, a Data Engineer and founder of 2BInformed. I focus on data engineering, system integrations, workflow automation, and the practical use of AI. Using SQL Server, Python, Dell Boomi, Fivetran, Snowflake, dbt, and n8n, I build reliable data pipelines, connect applications, improve data quality, and automate manual business processes. I’m also available for freelance projects involving integrations, automation, data solutions, workflow design, and technical consulting.
Comments (0)
Leave a Comment
No Comments Yet
Be the first to share your thoughts on this article!